
Network Route Optimization Made Easy with Performance IP (Demo)
Latency. It’s the mortal enemy of virtual dragon slayers, the bane of digital advertisers and the adversary of online retailers. Every end user has experienced the negative effects of latency, and even though they don’t always understand the intricacies of routing traffic through a global network, their responses to that latency can have a lasting impact on the companies whose networks aren’t functioning at peak performance.
Consider this: More than seven in 10 online gamers will play a lagging game for less than 10 minutes before quitting. As much as 78 percent of end users will go to a competitor’s site due to poor performance. And a one second delay can cause an 11 percent drop in page views, a seven percent drop in conversions and a 16 percent drop in customer satisfaction. For online merchants, even the big boys like Amazon, each one-second delay in page load time can lead to losses of $1.6 billion annually.
Milliseconds matter. Anyone focused on network optimization knows this. But did you know that Border Gateway Protocol (BGP) only routes traffic through the best path around 18 percent of the time? The lowest number of hops does not equate to the fastest route. And yet seeking a path with the least hops is the default.
What if there was a better way to find the lowest latency route to reach your end users?
Find the Fastest Network Route with Performance IP®
With INAP, finding the lowest latency route doesn’t require you to lift a finger. Customers in our data centers are connected to our robust global network and proprietary route optimization engine. Performance IP® enhances BGP by assessing the best-performing routes in real time.
This technology makes a daily average of nearly 500 million optimizations across our global network to automatically put your outbound traffic on the best-performing route. And with the meshed infrastructure of Tier 1 ISPs and our global network, you don’t have to choose between reliability, connectivity, and speed. You can download the datasheet on Performance IP® here.
“In online games, lag kills,” said Todd Harris, COO of Hi-Rez Studios, an INAP customer. “To deliver the best experience, we have to make sure that gamers are able to play on the best network while using the most efficient route. INAP delivers all of that.”
Skeptical about what Performance IP® can do for you? Let’s run a destination test. Below, we’ll take you through the test step by step so you can get the most out of the demo when you try it for yourself.
Breaking Down the Performance IP® Demo
You can access the demo from the INAP homepage or the Performance IP® page. Get started by entering your website URL or any destination IP. We’ll use ca.gov for our test purposes.
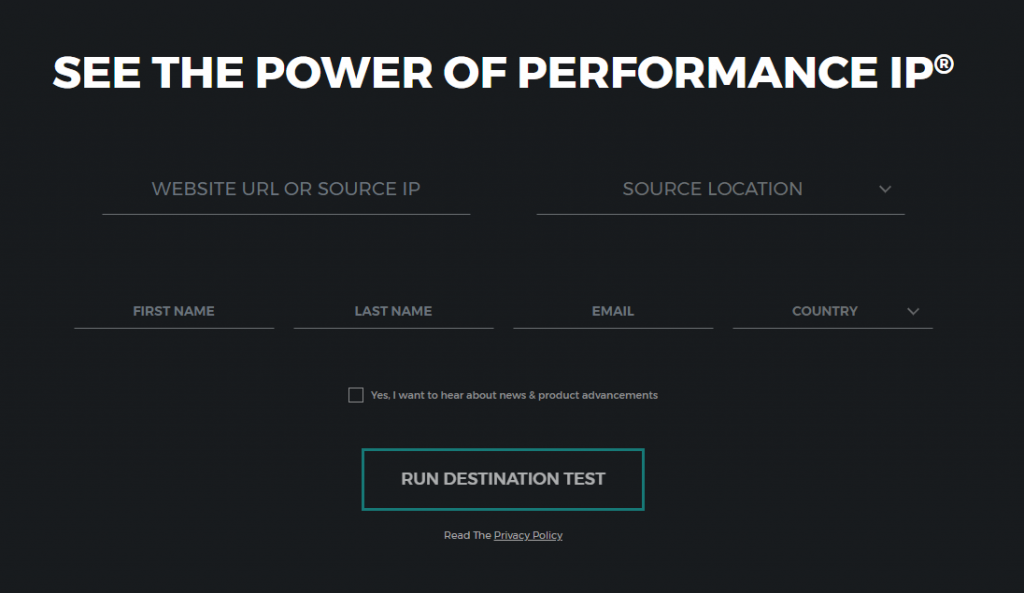
Next, choose your source location. The locations in the drop-down menu represent INAP’s data centers and network points of presence where you can take advantage of the Performance IP® service. Each market has a different blend of Tier 1 ISPs. Performance IP® measures all carrier routes out of the data center and optimizes your traffic on the fastest route to your target address.
Here, we’re running the test out of our Atlanta flagship data center, but you can test out all of our markets with the demo. We’ll run the route optimization test to our sample website, which is located in California. Once you have all your information entered, click “Run Destination Test.”
As you can see from the result of our test above, the shortest distance is not the lowest latency path. Each Greek letter on the chart represents an automonous system (AS). The Performance IP® service looked at seven carriers in this scenario and was able to optimize the route so that our traffic gets to its destination 21.50 percent faster—16.017 ms faster—than the slowest carrier.
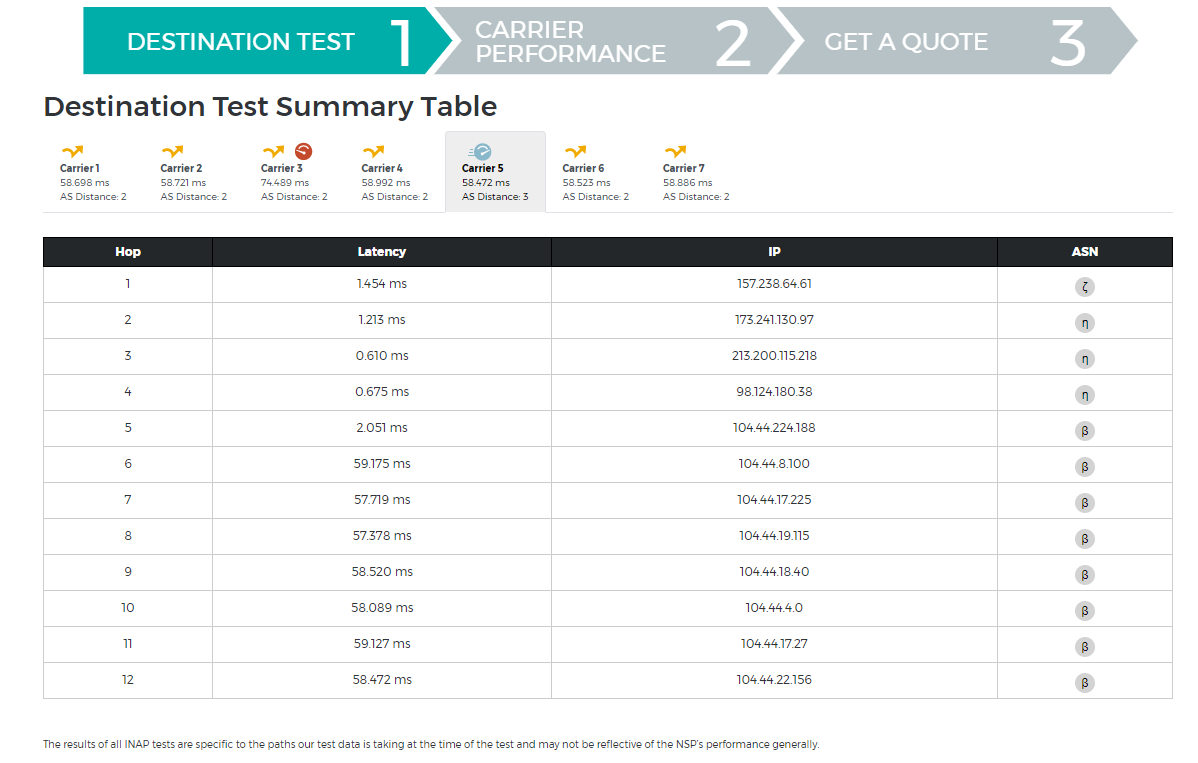
In the traceroute chart above, we can study the latency for the each carrier more closely. Although in this scenario the best perfroming carrier passed though three autonomous systems while all of the other carriers passed through only two, it was still the fastest. Note that default BGP protocol would have sent us through any of the other carriers, including the slowest route through Carrier 3.
Once you’ve had time to adequately study the outcome of the test, click “Continue” to see carrier performance over the last month. This chart measures the percentage of carrier prefixes originating from our Atlanta POP that had the best and worst performing routes for any given day of the month. While individual carrier performance can vary radically, if you’re a Performance IP® customer this won’t be a concern for you. Since the engine measures network paths millions of times a day, Performance IP® sends outbound traffic along the lowest latency path virtually 100 percent of the time.
The final tab of the demo allows you to study our product line-up and open a chat to get a quote. Performance IP® is available for INAP colocation customers and is included with INAP Cloud products. If you’re not interested in these infrastructure solutions, you can still purchase Performance IP® from one of our data centers and connect it to your environment.
Run the test for yourself, or chat with us now to get a quote.