
The instinct after Broadcom’s VMware pricing shift is to ask which alternative most resembles vCenter. That’s the wrong place to start. The right question is whether the alternative’s day-two console does the unglamorous work of running an environment — cluster health, VM lifecycle, storage, HA, migration — without a separate management appliance to license, patch, and depend on.
The Proxmox Web UI does, and it has for years. What’s changed is that people searching for VMware alternatives are now looking at it seriously, and most of the tutorials and how-to guides they find were written for home-lab audiences.
At HorizonIQ, we migrated our own hosted private cloud fleet from VMware to Proxmox. A footprint of ~300 VMs on just under 800 vCPU and 10 TB of RAM, backed by 90 TB of redundant Ceph and 225 TB of flash. Let’s take a tour of the Proxmox Web UI as it looks under enterprise load, framed against what a vCenter admin already knows.
What is the Proxmox Web UI, and how does it differ from vCenter?
The Proxmox Web UI is the browser-based management console built into every Proxmox VE node. There is no separate vCenter Server, no external appliance, no additional license SKU. Each node in a cluster serves the same GUI on port 8006, and each one can manage the entire cluster because Proxmox uses a distributed cluster file system (pmxcfs) to keep configuration state in sync.
In practical terms, you’re not paying for the console. You’re paying for the workload it runs.
That single design choice ripples through everything below. Failover doesn’t depend on a management appliance being reachable. There’s no “which node hosts vCenter today” question. Every node knows the whole cluster, and any node can drive it.
How do I access the Proxmox Web UI?
The Proxmox Web UI lives at https://<node-ip>:8006. That port – 8006 – is Proxmox’s reserved TCP port for the pveproxy service and needs to be open from wherever you administer the environment.
In production, we sit a load balancer in front of the cluster so administrators hit a single hostname and get routed to whichever node is healthy. In a home lab, you’d just point your browser at any node directly.
First-time login uses the credentials you set during install, against the Linux PAM standard authentication realm (same account you’d use for SSH). The Proxmox VE authentication realm holds users defined inside Proxmox itself and is what most operational accounts should live in.
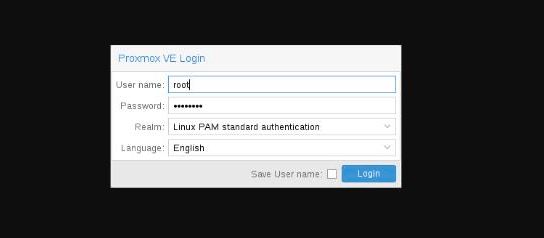
The Proxmox VE login dialog. Realm defaults to Linux PAM; Proxmox VE realm holds users defined in Proxmox itself.
If the environment isn’t subscribed to Proxmox’s enterprise support, a subscription reminder appears on login. Production clusters at HorizonIQ are subscribed and don’t see it. In practice, it’s a one-click dismissal that is cosmetic, not blocking.
What are the four regions of the Proxmox VE interface?
The Proxmox VE user interface is organized into four regions, and every screen you’ll work in reflects that layout.
At the top is the header, with the version string, a global search, and the buttons for creating a VM or container. On the left is the resource tree — the equivalent of the vSphere inventory pane — with four switchable views (Server, Folder, Pool, Tag) for different ways of grouping the same underlying objects. The center is the content panel, which changes depending on what you’ve selected in the tree. And at the bottom is the log panel, which streams task history and cluster events across the whole environment.
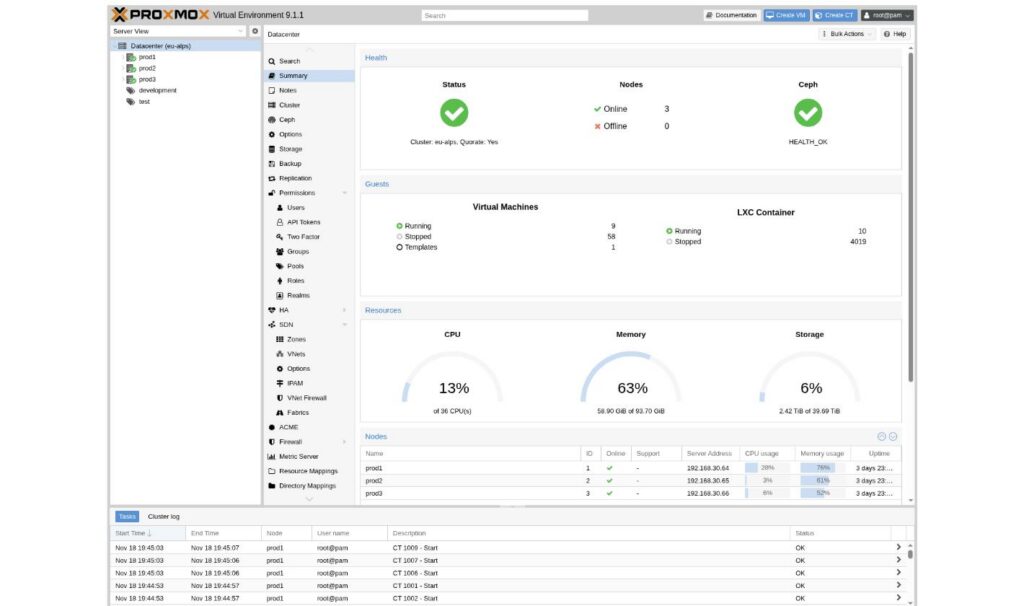
The Datacenter Summary panel – health, guests, CPU/memory/storage gauges, and the node list. This is where most operators live during a triage.
Clicking the Datacenter object at the top of the tree is the equivalent of clicking the vCenter root. The Summary tab gives you the at-a-glance health data you’d expect: cluster quorum, node online/offline count, Ceph health, VM and container counts, and the CPU/memory/storage gauges.
What can I configure from the Datacenter level?
The Datacenter-level menu is where the cluster-wide configuration lives. Here’s a quick tour of the panels a VMware admin will care about:
Cluster and Ceph
Creating a cluster is a modal dialog — pick a name, optionally define a second Corosync link for redundancy — and adding a second and third node is done by generating a Join Information blob on the founder and pasting it into the joiner.
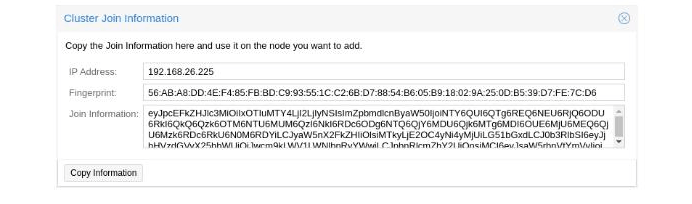
The Cluster Join Information dialog. Copy the base64 blob on the founder, paste into the joining node.
Options
Global keyboard layout, HTTP proxy, HA defaults, tag registry. The sort of settings you’d expect to find scattered across half a dozen vCenter dialogs are here on a single sortable list.
Storage
Add and configure every storage backend the cluster can see, and gate what content type (VM images, ISOs, container templates, backups) each backend is allowed to hold. At HorizonIQ, we use the local Ceph cluster on the Proxmox nodes themselves and offer it up as RBD for VMs and CephFS for ISOs and object storage. NFS to a SAN appliance is also a solid alternative. We tend to discourage iSCSI. While Proxmox supports iSCSI, HorizonIQ generally favors Ceph or NFS.
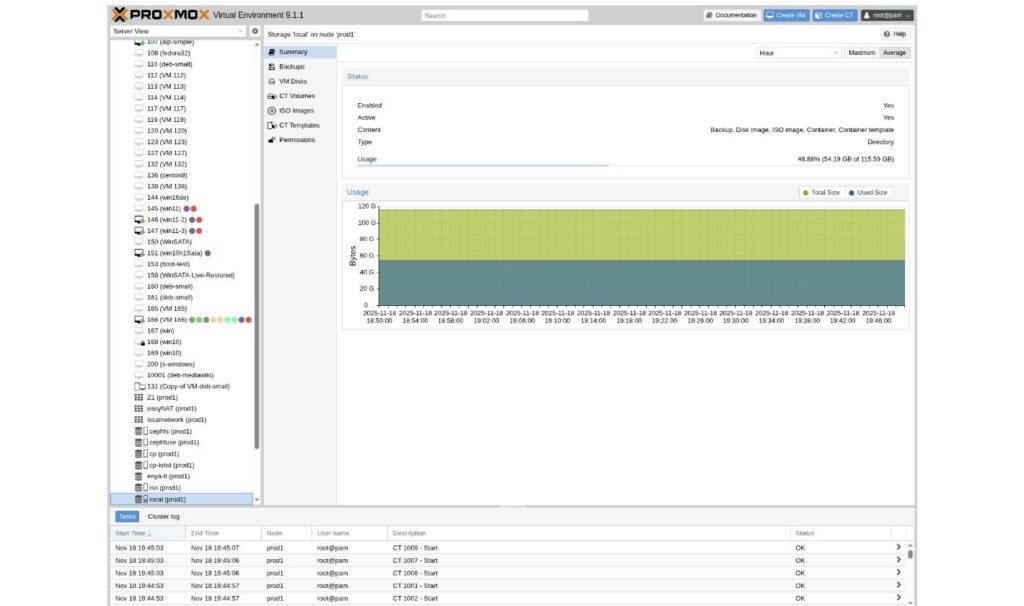
The Storage panel. Enabled/active status, content type gating, and a usage-over-time chart per backend.
HA
VMs aren’t protected by high availability by default. The HA section is where you nominate the ones that should restart on a surviving node if their host disappears.
Two things to note here for a vCenter admin: Proxmox VE 9.0 added native HA Resource Affinity Rules. They can keep related HA resources together or deliberately place redundant instances on different nodes. With the introduction of Proxmox VE 9.2, a built-in Dynamic Load Balancer was introduced. It can automatically migrate HA-managed guests based on real-time resource utilization while respecting HA rules.
Before that, we used an add-on called ProxLB to get DRS-style load redistribution and the proper affinity behavior that vCenter spoils admins with. It slots into the same UI once installed.
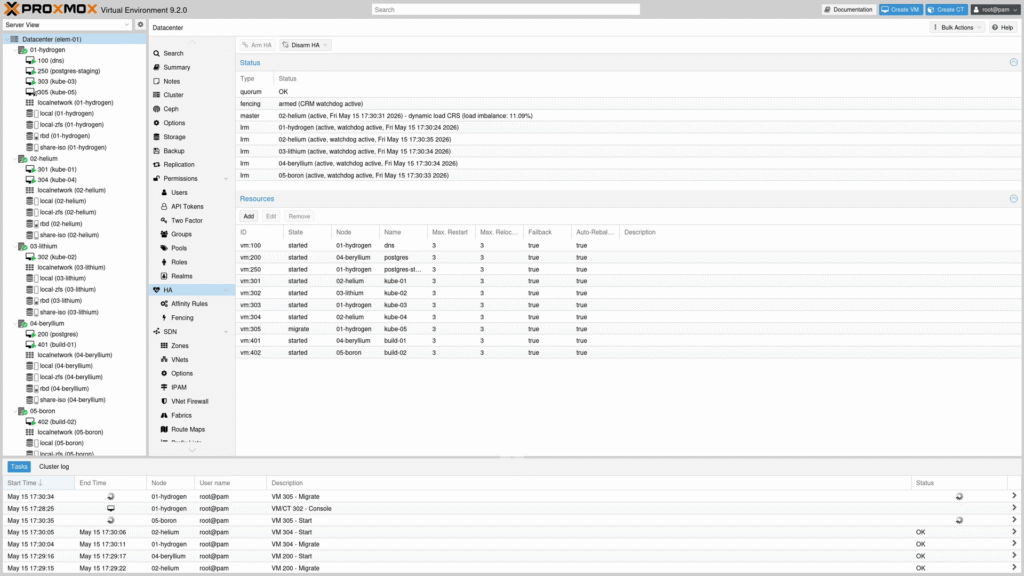
HA Manager Status. Quorum, master and LRM state per node, and the list of protected resources.
Permissions
Role-based, with LDAP and Active Directory realms configured under Permissions -> Realms. Two-factor authentication (TOTP and Yubikey) is supported out of the box.
SDN
Zones stand in for virtual distributed switches, VNets for port groups. Firewall rules can be applied at the VNet, node, or VM level. In a home lab, that’s a full-featured east-west security posture. In a data center, we use VLANs and dedicated firewall appliances for segmentation, so the built-in firewall stays out of our critical path.
How do I manage a node from the Proxmox Web UI?
Selecting a node in the tree pulls up the summary a VMware admin would expect on an ESXi host: real-time CPU/RAM/disk, historical charts, and every per-node knob (updates, firewall, certificates, Ceph, disk configuration, task history).
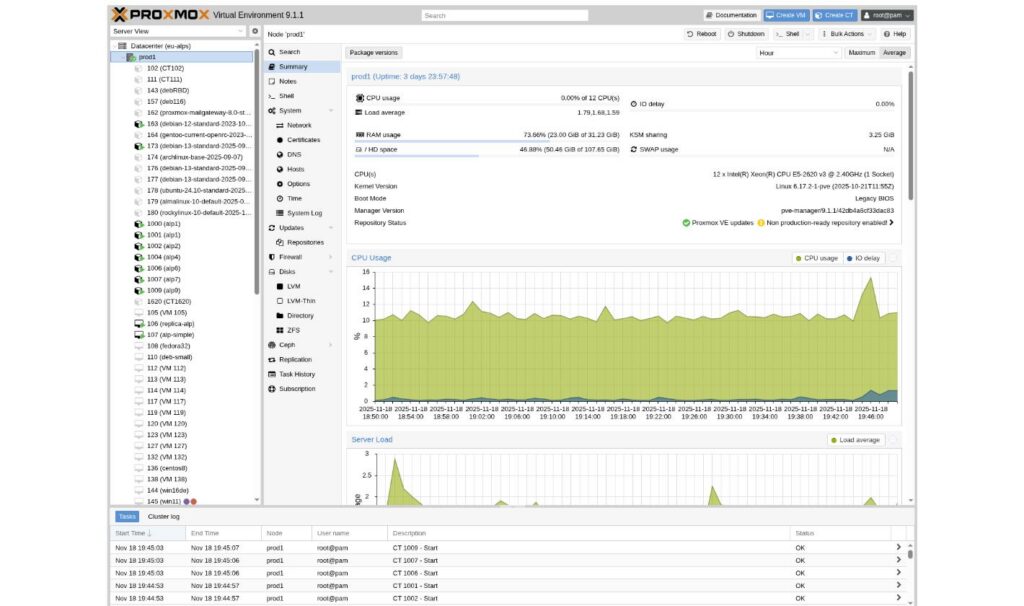
Node Summary. Real-time stats, historical CPU usage, and every per-node configuration menu on the left.
The one addition that has no vCenter analogue is a built-in shell. Every node exposes a full xterm.js terminal in the browser, no SSH client required. It’s the escape hatch for anything not yet in the GUI, and for out-of-hours triage, it’s genuinely faster than jump-hosting.
How do I manage VMs from the web interface?
The VM summary panel shows the data a vCenter admin already knows how to read: current host, resource allocation, live usage, guest OS, IP addresses (if the QEMU guest agent is installed), and a console button. The left-hand VM menu breaks out Hardware, Cloud-Init, Options, Snapshots, Backup, Replication, Firewall, and Permissions — each of which is a familiar concept under a slightly different label.
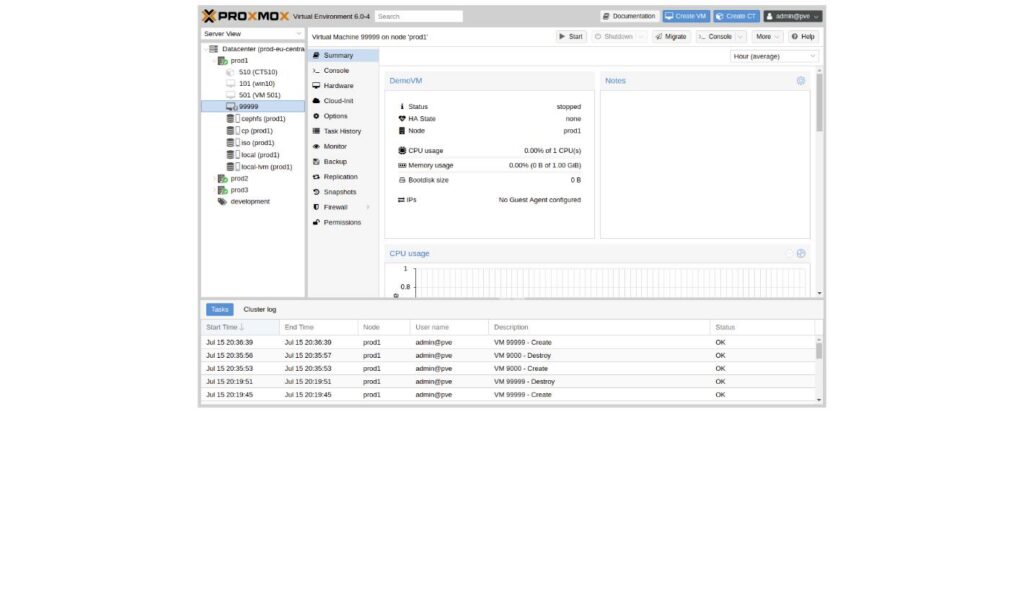 VM Summary. The left menu covers everything you would find under a vCenter VM inventory object.
The console is HTML5 by default and works well enough for initial ISO installs and out-of-band troubleshooting. SPICE is available for workloads that want a richer remote desktop experience. Hot-plug is supported for CPU and RAM but is finicky by guest OS. In practice, we reboot for hardware changes when it’s feasible.
The Create VM wizard walks the standard path — pick a node, a resource pool, tags, an ISO, then CPU/memory/disk. You can add multiple drives inside the wizard, but additional NICs or other hardware get attached after the initial create.
Migration
The vMotion equivalent works from the same right-click menu as everywhere else. With shared storage (Ceph, NFS) it’s a live migration in the vSphere sense. Without shared storage, Proxmox can still perform a live migration by transferring the VM’s local disk data to storage on the target node.
How does the Proxmox Web UI compare to vCenter?
Concept |
vCenter | Proxmox Web UI |
|---|---|---|
Management appliance |
vCenter Server (separate) | Every node serves the same GUI on port 8006 |
Inventory view |
Hosts and Clusters | Server View |
Distributed switch |
vDS | SDN Zone |
Port group |
Port Group | VNet |
Datastore |
Datastore | Storage (RBD, CephFS, NFS, ZFS…) |
Live migration |
vMotion | Migrate |
Cluster HA |
vSphere HA | Datacenter -> HA |
Load balancing |
DRS | Built-in Dynamic Load Balancer for HA-managed guests (PVE 9.2+) |
Affinity / anti-affinity |
DRS Rules | HA Resource Affinity Rules, or ProxLB |
Role-based access |
Global permissions | Permissions + Resource Pools |
Console |
Web Console / VMRC | HTML5 (built-in) or SPICE |
The tradeoff is real. Proxmox trades a polished DRS implementation and some vSphere-native niceties for the operational simplicity of not running a separate management stack. For most workloads, that trade is worth it.
What organizational views does the Proxmox Web UI offer?
Four, all sourced from the same underlying inventory:
Server View
The closest analogue to the vSphere Hosts and Clusters view — nodes with their VMs and containers nested underneath. It’s the default for a reason.
Folder View
Groups the cluster by object type: all nodes together, all VMs together, all storage together. Useful when you’re looking for something by kind rather than by location.
Pool View
Groups by resource pool. Resource pools are the closest Proxmox has to a vCenter folder. They exist both to group objects and to define permissions on those groups. If a team should only see their own workloads, a resource pool plus a role assignment is how you draw that line.
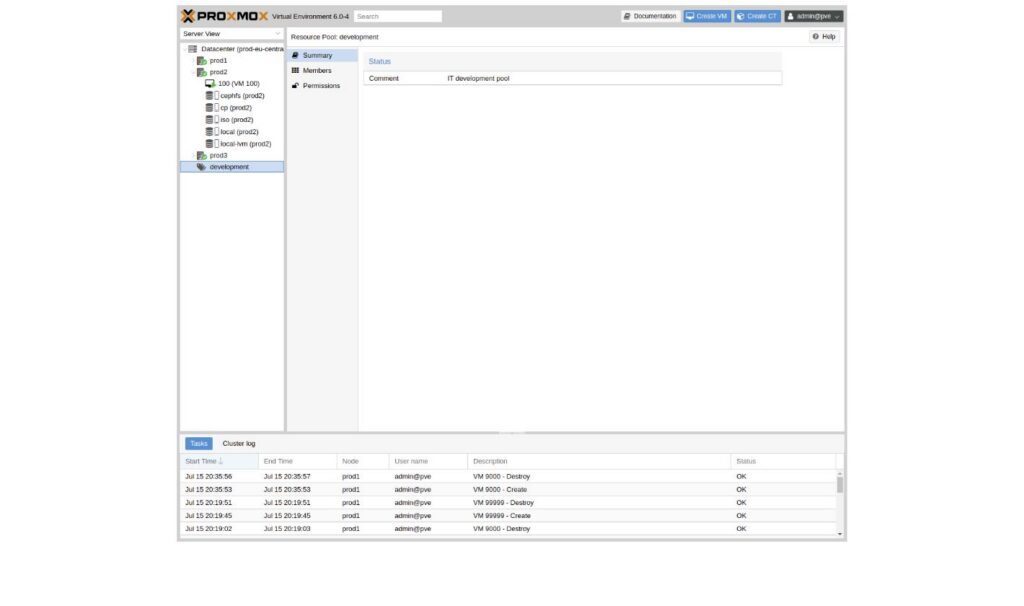
Resource Pool summary. Group objects and scope permissions together.
Tags
Every VM can carry any number of colored tags, and a dedicated tag view lets you filter across the whole environment. Tags are not designed to interact with user permissions – resource pools handle that – but you can restrict which tags a user is allowed to apply.
 Inline tag editor on a VM. Tags overlay the tree for a second, orthogonal way to slice inventory.
Why can’t I access the Proxmox Web UI? Common troubleshooting
The three most common reasons the Proxmox Web UI is unreachable, in the order you should check them:
- Port 8006 is not open. The pveproxy service listens on TCP 8006 on every node. Confirm with `ss -ltnp | grep 8006` on the node, then check the network path from the browser.
- Check the status and logs for pveproxy and pve-cluster. Restart pveproxy if appropriate; investigate quorum and cluster state before restarting pve-cluster.
- Certificate warning is blocking the browser. The default certificate is self-signed. For production, wire up an ACME (Let’s Encrypt) certificate under Node -> System -> Certificates and the warning goes away for good.
The practical takeaway
The Proxmox Web UI gets dismissed as a nice-to-have, usually by teams who still equate polished tooling with vendor tax. In practice, it does the unglamorous work of daily operations well, and it does it without a separate management appliance to license and depend on.
For a vCenter admin, the vocabulary shifts and a handful of features move from built-in to add-on, but the operating model is familiar enough that most of the learning curve is naming, not concept. Everything you needed vCenter to do at the fleet level lives at https://<any-node>:8006 – on any node, from any browser, with no additional server to keep alive.
At HorizonIQ, our Proxmox Managed Private Cloud adds the engineering, monitoring, support, and operational expertise needed to run Proxmox reliably at scale.
If a picture is worth a thousand words, HorizonIQ’s six-minute walkthrough of the Proxmox Web UI is worth the rest of this article.
Watch the tour, and contact us with the questions your migration actually raises.