Month: November 2019

INAP Executive Spotlight: Roberto Montesi, Vice President of Sales & Operations, International
In the INAP Executive Spotlight series, we interview senior leaders across the organization, hearing candid reflections about their careers, what they love about their work and big lessons learned along the way.
Next in the series is Roberto Montesi, Vice President of Sales & Operations, International for INAP. He also oversees international facilities, as well as web and VPS hosting provider, Funio, an INAP company.
In our conversation, Montesi discussed what he loves about his role at INAP, his passion for life-long learning and why Montreal is a strong market for INAP’s business. Read on to learn about these topics and more.
The interview has been lightly edited for clarity and length.
Tell us about your education and career path. Did you take any detours to get where you are today?
Technology and IT have been a part of my life since a very young age. I would jump at the opportunity to go help someone having desktop computer problems, so it makes sense that my first part time job was in technical support at a call center. As my career progressed, I took on leadership roles quickly, as my enthusiasm for the job would get noticed. These leadership roles have allowed me to spread my passion for this work and have my employees perform amazing customer service.
After a few years managing technical teams, I decided to continue my career in management, but focused on touching multiple departments, including retention, sales, dispatch center, finance and collections. At the same time, I decided to also invest in revenue properties and start a restaurant with a couple of business partners. But those stories would lead us way off track. After a few years of managing and building call centers, I decided to go back into technology at iWeb Technologies, Inc. The smaller sized company allowed me to get to know everyone quickly, and I was excited to go back to managing a team of highly technical CSR.
After a few years of building up the team and center of expertise, my passion for our products grew—specifically, colocation. I look at it as similar to owning property and leasing an apartment, except we lease space and power. At that time, during a re-organization, the sales team and collections team were reporting to me temporarily while we hired a new director. Once he was in place, he proposed that I move on to the sales organization as a senior account manager, focusing on our top customers. From there, after the INAP acquisition, I am now leading the International teams.
Where are you seeing the most momentum and opportunities within the international business unit this year?
We have seen some great breakthroughs in Montreal with VFX, and our new London Region for Cloud and Colocation has helped to build traction on pipeline growth. The gaming sector is also still very attractive to us, as is Ad Tech.
What’s a typical day like for you?
Since I oversee sales and operations for our international markets, I would say no two days are the same. In operations, we find ourselves reacting to plans that need to be either moved up faster or delayed to prioritize something else. On the sales side, my days start by looking at the forecast and pipeline to see where the team might need my support. My one-on-ones planned with my team members are crucial to help me organize my future schedule around their needs.
What do you enjoy most about your role at INAP? What do you think is the best part about being in the data center and cloud industry?
I have been a part of the company for 11 years, and what keeps me on board and engaged are the customers. Seeing how we support customers as they grow and meet their objectives is what makes me love my job. Also, the amount of technical learning I get on data centers, solutions, network and future technology. Why wouldn’t you want to be working for us?
With the roles you’ve held at INAP and iWeb, what have been the most exciting changes over the years? What’s been a constant – something you’re glad has stayed the same?
Having worked for three very different CEOs, it’s great to see Pete looking outside the box on strategy. He wants to grow the company and brings many ideas to the table while surrounding himself with a great executive team of people he trusts. I think we are well positioned to hit our targets and keep growing the company. On the operations side, we execute well. I’m happy to see leaders staying on with us over five or more years, still working hard to ensure we deliver to our customers. Without a great operations team, it would be hard to be the provider so many customers trust.
Out of the qualities you possess, which do you think has had the greatest influence on your success?
Again, my hunger to learn more and never back down from a challenge. To have the trust of so many in the company and being allowed to lead such an important part of the business, it’s an amazing feeling. But I do have to say I love winning a new customer. That feeling of beating your competitors never gets old.
You’re based in Montreal, a city that loves to tout its bona fides as major Canadian tech hub. Why do you think it’s an ideal market for our industry?
Montreal/Canada has a great relationship with the U.S. It’s an easy extension for any American to come up to Montreal and have access to so much great talent in our industry. I can say that data centers are growing fast here because of the very low cost on power and land taxes, but also the colder temperatures that permit us to run free cooling up to 10 months a year. We also have fiber rich density coming up from Ashburn and Europe. This makes us a great location for customers looking for Edge locations.
What are some of the big lessons you’ve learned in your career?
Surround yourself with great leaders who understand ownership. We are all interdependent to make this a successful journey while we are here. Don’t try to do it alone. It doesn’t scale. And lastly listen to your managers and other executives, they are my mentors even if they don’t know it.
Explore HorizonIQ
Bare Metal
LEARN MORE
Stay Connected


About Author


Survey: How Do IT Leaders Grade Their Data Center and Cloud Infrastructure Strategies?
We’re still merely entering the hybrid and multicloud era of information technology, but according to new survey research from INAP, the transformation is about to hit warp speed, a trend we see continuing in our latest survey. Nearly 9 in 10 organizations with on-premise data centers plan to move at least some of their workloads off-premise into cloud, managed hosting or colocation in the next three years.
As more companies diversify their infrastructure mix, how confident are IT leaders and managers that they’re taking the right approach?
For INAP’s second annual installment of the State of IT Infrastructure Management survey, we asked 500 IT leaders and infrastructure managers to assess their data center and cloud strategies, assign a letter grade and give us their thoughts on why they chose a particular rating.
How do the grades stack up among participants? What factors are most closely associated with A-grade infrastructures? And why do some infrastructure strategies fall short?
Making the Grade in the Hybrid IT and Multicloud Era
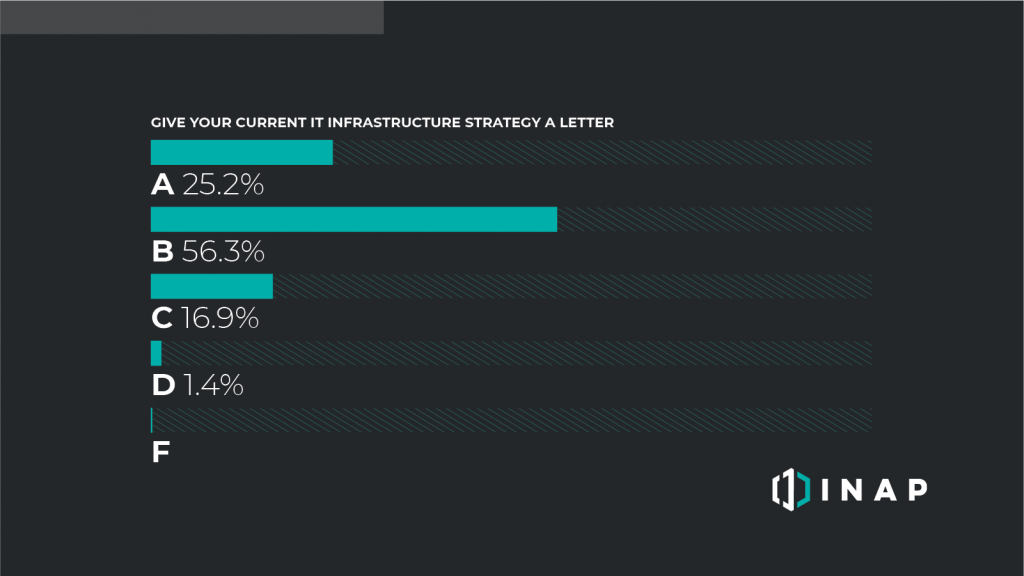
Instead of the classic bell curve so many of us were subject to during our years in academia, most of the IT infrastructure management professionals say their infrastructure strategy deserves an above average grade, with the majority—56.3 percent of respondents—giving their infrastructures a B. Roughly 19 percent think they deserve a C or below. While the results can be read as a vote of confidence for multiplatform, hybrid cloud and multicloud strategies, most respondents say there’s still plenty room for improvement: Only 1 in 4 participants (25.2 percent) gave their infrastructure strategies an A.
Factors Most Associated with A-Grade Infrastructure
Still, it’s worth asking: What factors distinguish A’s from the rest of the crowd?
Four groups in the data, regardless of company size, industry and headcount, are strongly correlated with high marks:
Off-Premise Migrators
A’s have a significantly smaller portion of their workloads on-premise (30 percent of workloads, on average) compared to C’s and below (45 percent).
Colocation Customers
Thirty-one percent of IT pros who have colocation as part of their infrastructure mix give themselves an A. This is six points higher than the total population.
Cloud Diversifiers
For companies already in the cloud, those who only host with public cloud platforms (AWS, Azure, Google) are less likely to give themselves A’s than those who adopt multicloud platform strategies—18 percent vs. 29 percent, respectively.
Managed Services Super Users
The more companies rely on third parties or cloud providers to fully manage their hosted environments (up to the application layer), the more likely they are to assign their infrastructure strategy an A. The average share of workloads fully managed: A’s (71 percent), B’s (62 percent), C’s (54 percent).
Why Some IT Infrastructures Strategies Fall Short
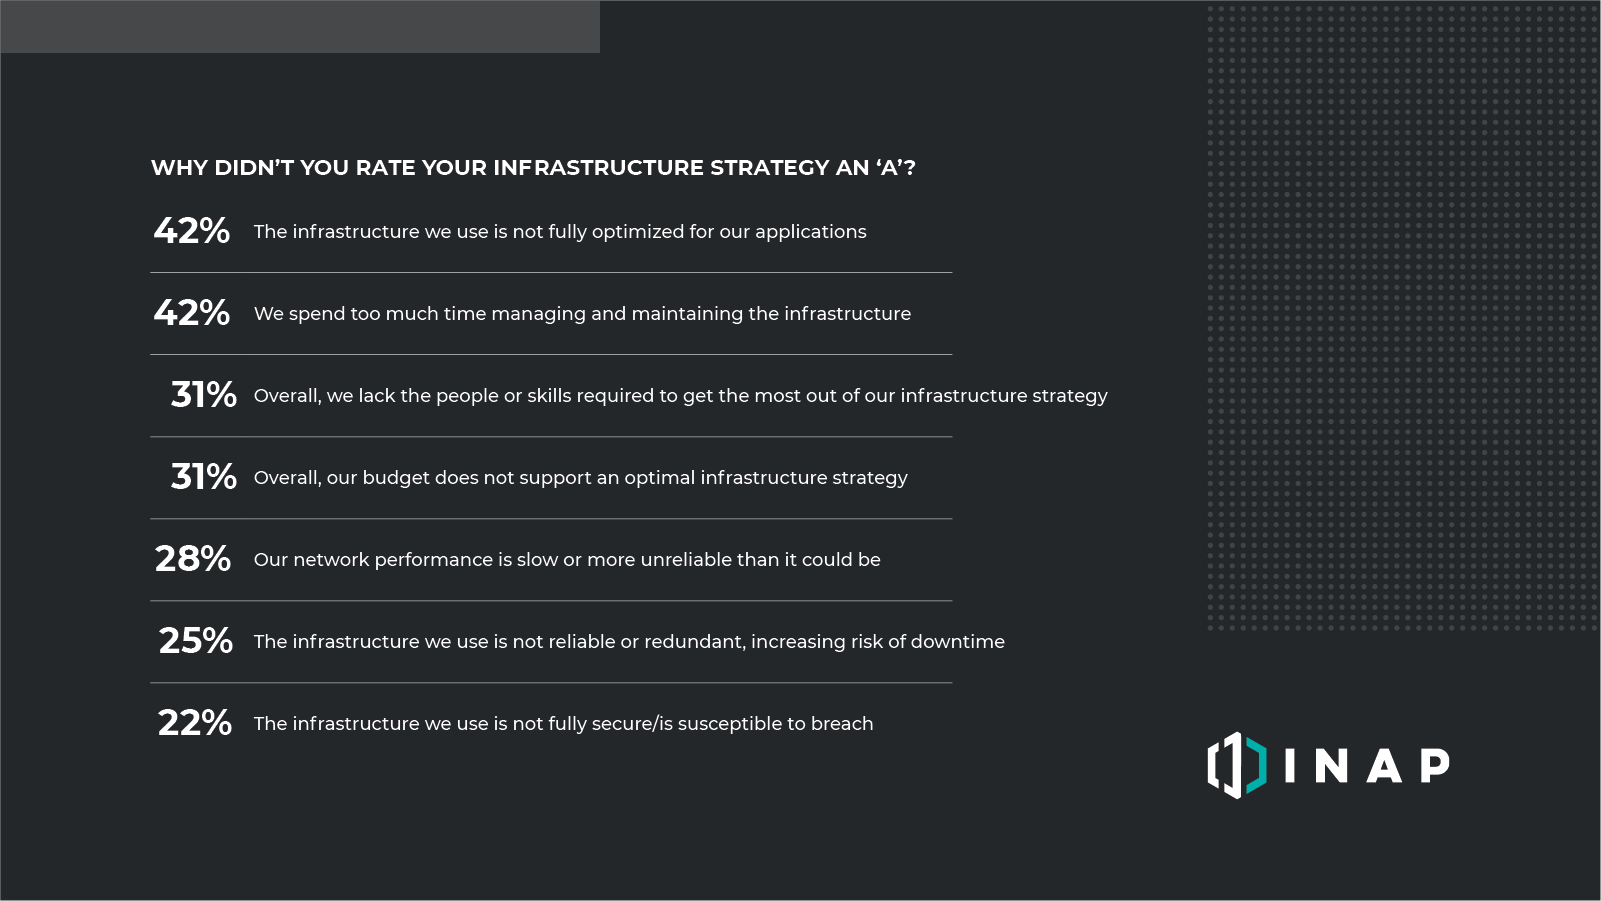
From the above results, no single explanation for why strategies did not earn top marks were selected by a fewer than a fifth of respondents, but two clearly lead the pack:
- Infrastructure not fully optimized for applications
- Too much time managing and maintaining the infrastructure
The first leading factor speaks to a simultaneous benefit and challenge of the multicloud and hybrid IT era. It’s more economical than ever to find a mix of infrastructure solutions that match the needs of individual workloads and applications. The flip side to that benefit is the simple fact that adopting new platforms can quickly lead to environment sprawl and raise the complexity of the overall strategy—making the goal of application optimization a tougher bar to clear.
The second leading factor—improper time allocation—underscores a central theme of IT infrastructure management that will be discussed in greater depth in a future blog.
Senior Leaders vs. Non-Senior IT Pros
As previously noted, only 1 in 4 participants gave their infrastructure strategies an A. That number falls to 1 in 8 (12.6 percent) if we remove senior IT leaders from the mix. Non-senior infrastructure managers are also two times more likely to grade their infrastructure strategy a C. In other areas of the State of IT Infrastructure Management survey, senior leaders generally held a more optimistic outlook, and the infrastructure grades were no exception.
Why might this be? We can only speculate, but senior leaders may be loath to give a low grade to a strategy they had a large part in shaping. Or perhaps it’s that non-senior leaders deal with more of the day-to-day tasks associated with infrastructure upkeep and don’t feel as positive about the strategy. Whatever the reason, these two groups are not seeing eye to eye.
Strategizing to Earn the A-Grade
When considering solutions—be it cloud, colocation and/or managed services—a lesson or two can be taken from those A-grade infrastructure strategies, and maybe from the C’s and below, as well.
If you’re ready to level-up your strategy, but unsure where to start, INAP can help. We offer high-performance data center, cloud, network and managed services solutions that will earn your infrastructure strategy an A+.
Explore HorizonIQ
Bare Metal
LEARN MORE
Stay Connected


About Author
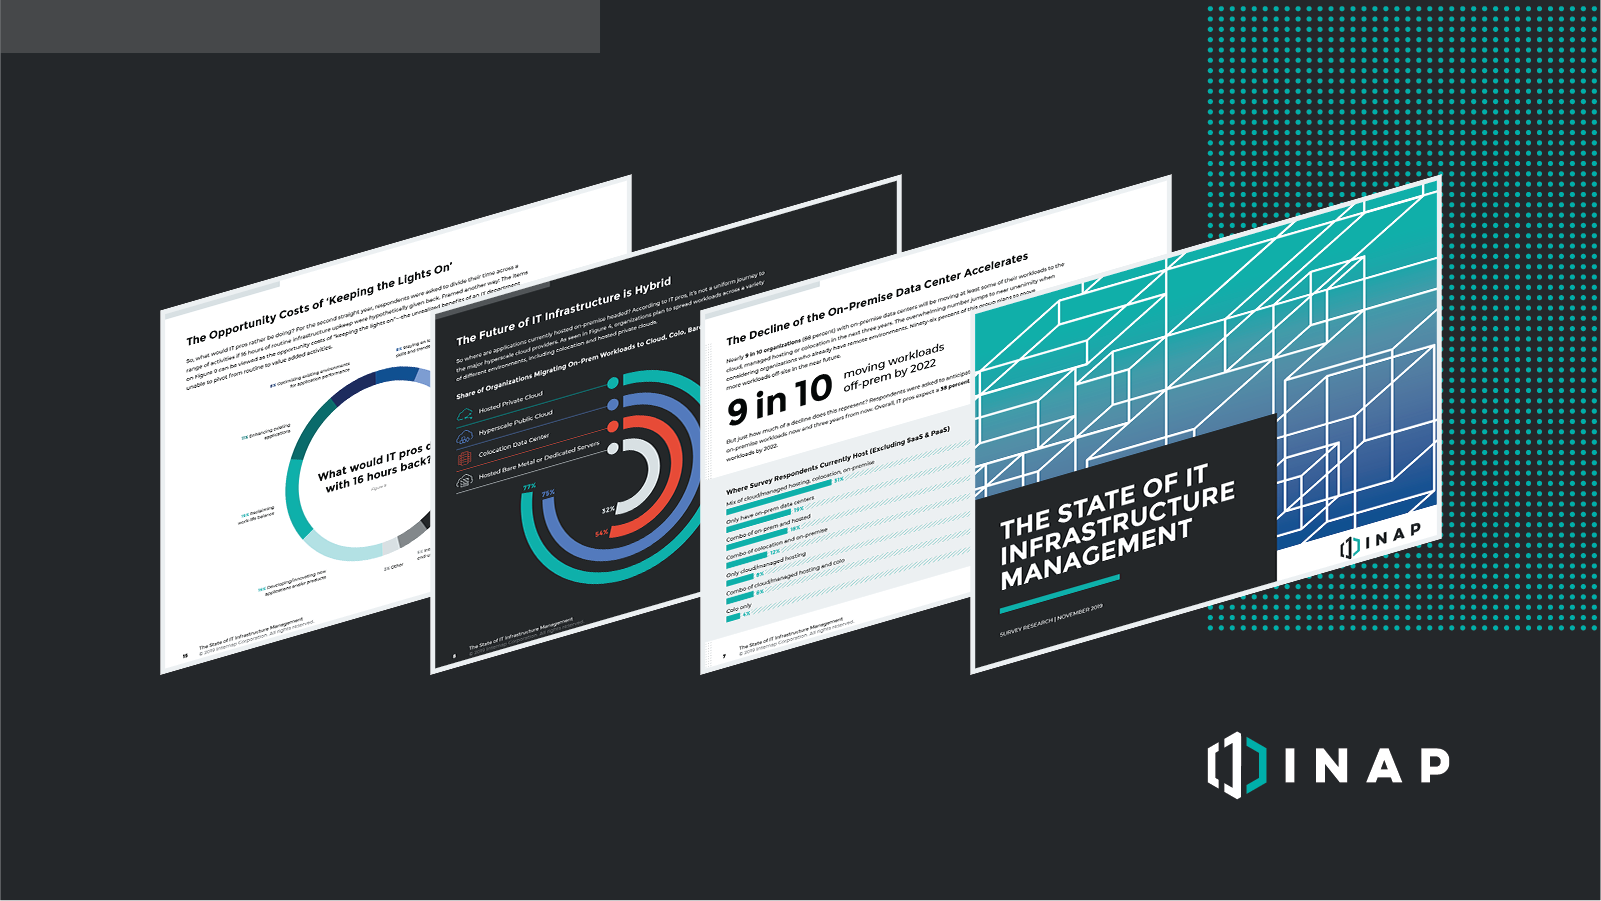
New Survey Report: The State of IT Infrastructure Management
What is the state of enterprise IT infrastructure, and what insights can we glean from the perspectives of the IT professionals responsible for its management and operation?
To answer these questions and more, INAP surveyed 500 IT professionals with data center, server and cloud infrastructure responsibilities at companies in the U.S. and Canada to create the second annual State of IT Infrastructure Management report.
In this year’s report, we delve further into what’s driving the decline of on-premise data centers and highlight the factors associated with successful infrastructure strategies in the hybrid and multicloud era. Plus, we highlight where the results show an acceleration of the major themes established in last year’s survey.
Download the report and read on to learn what we discovered.
Key Trends and Takeaways from the Latest Survey
Strategic Room for Improvement
We asked IT pros to assign a letter grade to their current infrastructure strategy and found that a majority of IT pros don’t think their current infrastructure strategies deserves a top grade. Only 1 in 4 (25.2 percent) respondents, gave their infrastructures an A. In the report, we narrow down what factors earned the top grade, and the areas for improvement for those who assigned their infrastructures a lower grade.
The Decline of On-Prem Accelerates
The next three years will see a significant reduction in the number of workloads powered by on-premise data centers or server rooms. Continuing the trend noted in last year’s report, 88 percent of survey participants expect to move at least part of their workloads off-premise over the next three years. Learn which solutions will be top destinations for these latest migrations in the report.
![]()
Performance Trumps Economics
Network performance emerges as the top reason for moving more workloads to colocation facilities or the cloud, while economic factors like expected cost savings of closing down on-premise facilities come in fifth. We’ve identified the ‘Big 4’ reasons driving the off-prem migration, all of which make a compelling case for why the death of the on-premise data center is perhaps inevitable within the next decade.
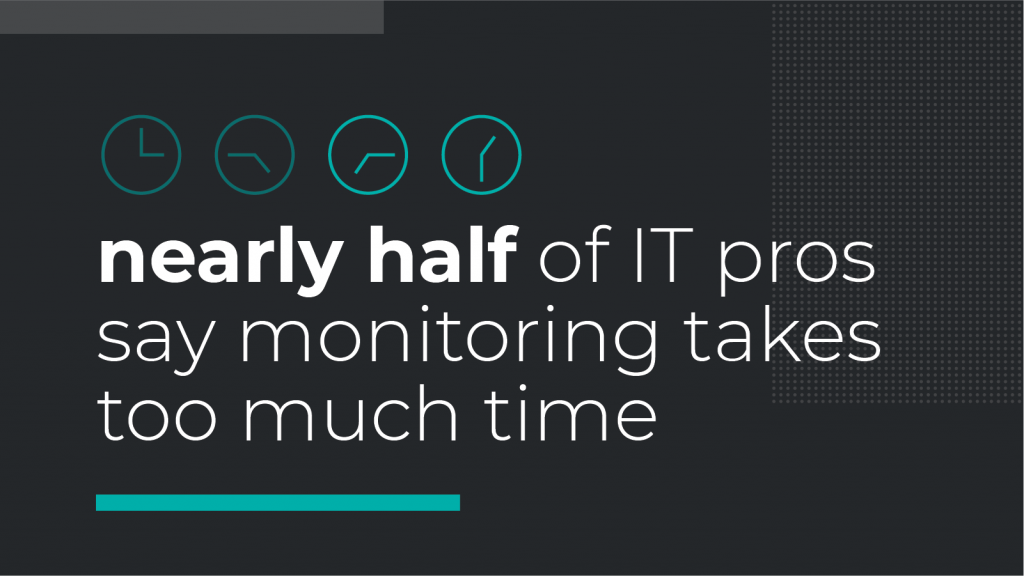
Monitoring Leads List of Routine Time Drains
Nearly half of IT professionals who say infrastructure monitoring is among their job responsibilities feel they are spending too much time on it—the No. 1 time drain for the second consecutive year. We asked these professionals again what they would do if they were able to remove routine activities like server monitoring and maintenance. Last year, the No. 1 answer was reclaiming work-life balance. This year, that answer fell to the No. 3 spot. Learn more about what professionals would do with 16 hours back by downloading the report below.
The Leadership Disconnect
On several issues—department headcount, optimism around strategy, efficacy of hybrid and multicloud—senior IT leaders hold starkly different views than non-senior infrastructure managers. Throughout the report, we explore these disparities and point to potential reasons for these differences in opinion.
Take a Deeper Dive
To read about these insights and more, download the report below—and keep an eye on our ThinkIT blog over the next few weeks as we break down each of these topics in greater depth.
Explore HorizonIQ
Bare Metal
LEARN MORE
Stay Connected
About Author
New Survey Report: The State of IT Infrastructure Management
What is the state of enterprise IT infrastructure, and what insights can we glean from the perspectives of the IT professionals responsible for its management and operation?
To answer these questions and more, INAP surveyed 500 IT professionals with data center, server and cloud infrastructure responsibilities at companies in the U.S. and Canada to create the second annual State of IT Infrastructure Management report.
In this year’s report, we delve further into what’s driving the decline of on-premise data centers and highlight the factors associated with successful infrastructure strategies in the hybrid and multicloud era. Plus, we highlight where the results show an acceleration of the major themes established in last year’s survey.
Download the report below and read on to learn what we discovered.
Key Trends and Takeaways from the Latest Survey
Strategic Room for Improvement
We asked IT pros to assign a letter grade to their current infrastructure strategy and found that a majority of IT pros don’t think their current infrastructure strategies deserves a top grade. Only 1 in 4 (25.2 percent) respondents, gave their infrastructures an A. In the report, we narrow down what factors earned the top grade, and the areas for improvement for those who assigned their infrastructures a lower grade.
The Decline of On-Prem Accelerates
The next three years will see a significant reduction in the number of workloads powered by on-premise data centers or server rooms. Continuing the trend noted in last year’s report, 88 percent of survey participants expect to move at least part of their workloads off-premise over the next three years. Learn which solutions will be top destinations for these latest migrations in the report.
![]()
Performance Trumps Economics
Network performance emerges as the top reason for moving more workloads to colocation facilities or the cloud, while economic factors like expected cost savings of closing down on-premise facilities come in fifth. We’ve identified the ‘Big 4’ reasons driving the off-prem migration, all of which make a compelling case for why the death of the on-premise data center is perhaps inevitable within the next decade.
Monitoring Leads List of Routine Time Drains
Nearly half of IT professionals who say infrastructure monitoring is among their job responsibilities feel they are spending too much time on it—the No. 1 time drain for the second consecutive year. We asked these professionals again what they would do if they were able to remove routine activities like server monitoring and maintenance. Last year, the No. 1 answer was reclaiming work-life balance. This year, that answer fell to the No. 3 spot. Learn more about what professionals would do with 16 hours back by downloading the report below.
The Leadership Disconnect
On several issues—department headcount, optimism around strategy, efficacy of hybrid and multicloud—senior IT leaders hold starkly different views than non-senior infrastructure managers. Throughout the report, we explore these disparities and point to potential reasons for these differences in opinion.
Take a Deeper Dive
To read about these insights and more, download the report below—and keep an eye on our ThinkIT blog over the next few weeks as we break down each of these topics in greater depth.
Explore HorizonIQ
Bare Metal
LEARN MORE
Stay Connected
About Author

New York & New Jersey Data Center Market Overview
The New York city metro area—the largest in the U.S.— requires a robust data center market to readily deliver service to 20.1 million people living in the area. The market is being driven by the financial, healthcare, media, and technology industries, all looking for hybrid solutions to get the most out of their infrastructures.
The data center market in this region was initially dominated by large enterprises that operated their own facilities, but the financial crash in 2009 spurred data center providers to search the area for space and opportunities. Since then, the New York and New Jersey data center markets have begun to stabilize, with users weighing the pros and cons of deploying off-premise infrastructure solutions in Manhattan or New Jersey. In 2018, New York’s MW net absorption rate stood at 1.2, while New Jersey’s MW absorption rate stood at 4.8, according to JLL.
In Manhattan, data centers are typically built in high-rises and older buildings that have been converted to meet security and redundancy needs. In New York, providers are focused on upgrading these buildings to meet ever-changing and increasing security needs. In New Jersey, a mix of turnkey and shell space, allows the market to meet hyperscale and enterprise needs.
For those considering data centers in New Jersey, specifically the northern area, its proximity to New York City, strong infrastructure, and pro-business climate are all appealing factors. But no matter which location users choose to deploy, the region as a whole benefits from a strong infrastructure for connectivity due to the demands of the businesses headquartered in the area.
Considering New York or New Jersey for a colocation, network or cloud solution? Read on to learn why we’re confident you’ll call HorizonIQ your future partner in this competitive market.
HorizonIQ’s New York and New Jersey Data Centers
HorizonIQ has seven data centers and points of presence in the New York/New Jersey metro area, with our flagship facility located in Secaucus, N.J., at 1 Enterprise Avenue.
The 101,000-square-foot flagship New Jersey data center is designed with Tier 3 compliant attributes and offers high-density configurations including cages, cabinets, and suites. Our New Jersey data center offers break rooms, meeting rooms, and dedicated works areas are also available at the facility. Strategically located outside of a 500-year floodplain and seismic zones, our New Jersey data center offers the high availability you need to stay connected to your users.
HorizonIQ’s New Jersey and New York data centers give you a connection to London, Boston, Montreal, Chicago, and Washington D.C. through our high-capacity private fiber backbone. HorizonIQ Performance IP® and Connectivity Solutions product suite provide high availability and scalable connectivity services across our global network.
Average latency benchmarks on the backbone connection from our Secaucus, New Jersey data center:
- London: Under 78.0 ms
- Boston: Under 7.3 ms
- Chicago: Under 22.0 ms
- Washington D.C.: 7.0 ms
Download the spec sheet on our New Jersey and New York data centers and POPs here [PDF].
The flagship Secaucus, New Jersey data center also includes the following features:
- Power and Space: 20 MW of utility power, 36-inch raised floor, fully integrated critical infrastructure monitoring
- Energy Efficient Cooling: 1,200 tons of cooling capacity and N+1 with concurrent maintainability
- Security: 24/7/365 onsite staff, video surveillance, key card, and secondary biometric authentication
- Network: HorizonIQ Performance IP® and Metro Connect fiber to enable high performance connectivity in metro market
- Compliance: PCI DSS, HIPAA, SOC 2 Type II, LEED, Green Globes and ENERGY STAR
Download the spec sheet on our Secaucus, New Jersey data center here [PDF].
Spend Portability Appeals for Future-Proofing Infrastructure
Organizations need the ability to be agile as their needs change. With HorizonIQ Interchange, there’s no need to worry about getting locked into a long-term infrastructure solution that might not be the right fit years down the road.
Colocation, Bare Metal, and Private Cloud solutions are eligible for Interchange. The program allows customers to exchange infrastructure environments a year (or later) into their contract so that they can focus on current-state IT needs while knowing they will be able to adapt to future-state realities.
There are a variety of business cases for Interchange, including a move from colocation to a bare metal or private cloud environment, or a re-deploy of applications to a new hosted environment. Geographic flexibility is a common reason for a strategic shift. For example, a company based in a HorizonIQ data center in New Jersey may see an increase for demand for its SaaS solution in the Southeastern U.S. To be closer to its customers, the company can shift to a custom-engineered solution in one of HorizonIQ’s two Flagship data centers in Atlanta.
You can learn more about the HorizonIQ Interchange by downloading the FAQ.
Gain an Edge with HorizonIQ’s Connectivity Solutions
In a metro area that boasts a strong infrastructure, HorizonIQ’s connectivity solutions and global network can give you the boost you need to outpace your competition. By joining us in our New Jersey flagship or New York data centers, you join HorizonIQ’s global network, which includes more than 600,000 square feet of leasable data center space and is woven together by our high-performance network backbone and route optimization engine.
Our high-capacity network backbone and one-of-a-kind, latency-killing Performance IP® solution is available to all New York and New Jersey data center customers. This proprietary technology automatically puts your outbound traffic on the best-performing route. Once you’re plugged into the HorizonIQ network, you don’t have to do anything to see the difference.
Explore HorizonIQ
Bare Metal
LEARN MORE
Stay Connected


About Author

Network Route Optimization Made Easy with Performance IP (Demo)
Latency. It’s the mortal enemy of virtual dragon slayers, the bane of digital advertisers and the adversary of online retailers. Every end user has experienced the negative effects of latency, and even though they don’t always understand the intricacies of routing traffic through a global network, their responses to that latency can have a lasting impact on the companies whose networks aren’t functioning at peak performance.
Consider this: More than seven in 10 online gamers will play a lagging game for less than 10 minutes before quitting. As much as 78 percent of end users will go to a competitor’s site due to poor performance. And a one second delay can cause an 11 percent drop in page views, a seven percent drop in conversions and a 16 percent drop in customer satisfaction. For online merchants, even the big boys like Amazon, each one-second delay in page load time can lead to losses of $1.6 billion annually.
Milliseconds matter. Anyone focused on network optimization knows this. But did you know that Border Gateway Protocol (BGP) only routes traffic through the best path around 18 percent of the time? The lowest number of hops does not equate to the fastest route. And yet seeking a path with the least hops is the default.
What if there was a better way to find the lowest latency route to reach your end users?
Find the Fastest Network Route with Performance IP®
With INAP, finding the lowest latency route doesn’t require you to lift a finger. Customers in our data centers are connected to our robust global network and proprietary route optimization engine. Performance IP® enhances BGP by assessing the best-performing routes in real time.
This technology makes a daily average of nearly 500 million optimizations across our global network to automatically put your outbound traffic on the best-performing route. And with the meshed infrastructure of Tier 1 ISPs and our global network, you don’t have to choose between reliability, connectivity, and speed. You can download the datasheet on Performance IP® here.
“In online games, lag kills,” said Todd Harris, COO of Hi-Rez Studios, an INAP customer. “To deliver the best experience, we have to make sure that gamers are able to play on the best network while using the most efficient route. INAP delivers all of that.”
Skeptical about what Performance IP® can do for you? Let’s run a destination test. Below, we’ll take you through the test step by step so you can get the most out of the demo when you try it for yourself.
Breaking Down the Performance IP® Demo
You can access the demo from the INAP homepage or the Performance IP® page. Get started by entering your website URL or any destination IP. We’ll use ca.gov for our test purposes.
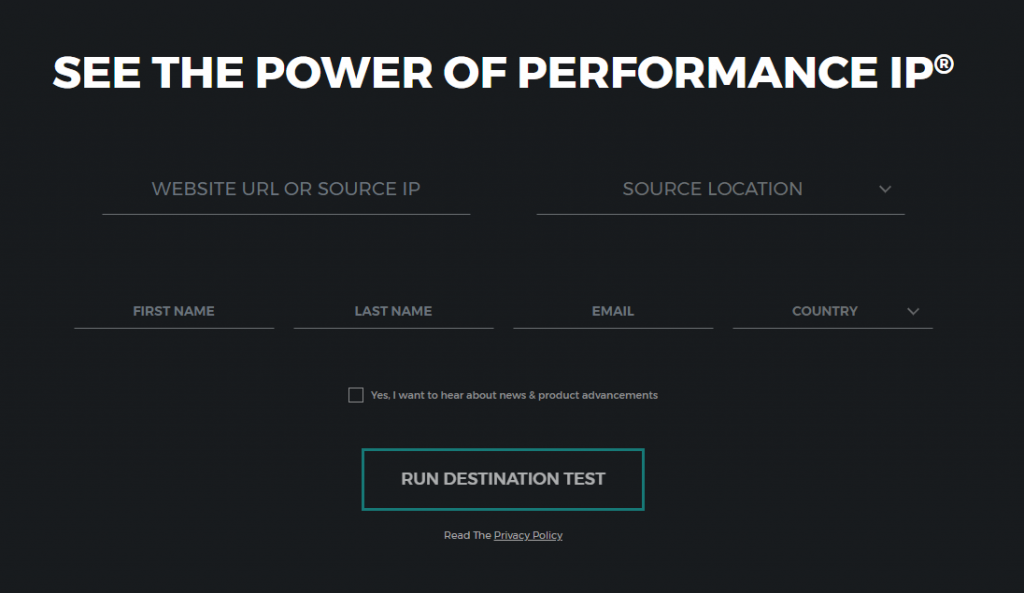
Next, choose your source location. The locations in the drop-down menu represent INAP’s data centers and network points of presence where you can take advantage of the Performance IP® service. Each market has a different blend of Tier 1 ISPs. Performance IP® measures all carrier routes out of the data center and optimizes your traffic on the fastest route to your target address.
Here, we’re running the test out of our Atlanta flagship data center, but you can test out all of our markets with the demo. We’ll run the route optimization test to our sample website, which is located in California. Once you have all your information entered, click “Run Destination Test.”
As you can see from the result of our test above, the shortest distance is not the lowest latency path. Each Greek letter on the chart represents an automonous system (AS). The Performance IP® service looked at seven carriers in this scenario and was able to optimize the route so that our traffic gets to its destination 21.50 percent faster—16.017 ms faster—than the slowest carrier.
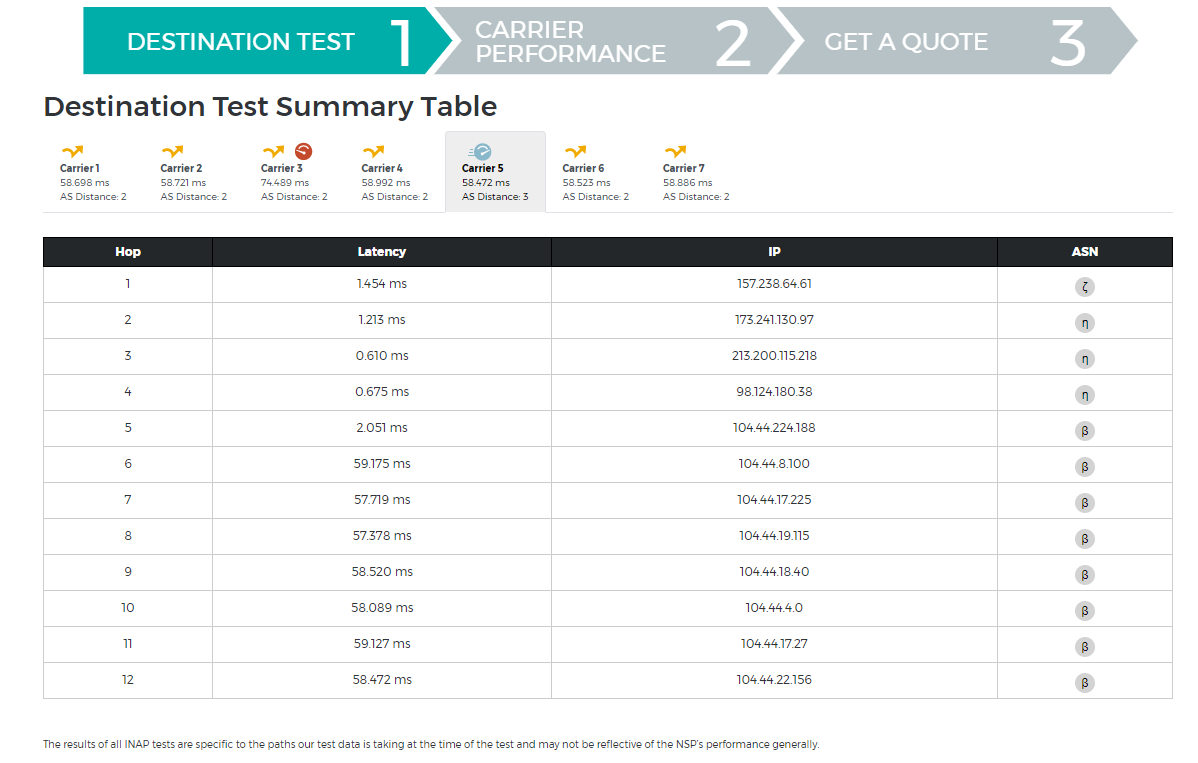
In the traceroute chart above, we can study the latency for the each carrier more closely. Although in this scenario the best perfroming carrier passed though three autonomous systems while all of the other carriers passed through only two, it was still the fastest. Note that default BGP protocol would have sent us through any of the other carriers, including the slowest route through Carrier 3.
Once you’ve had time to adequately study the outcome of the test, click “Continue” to see carrier performance over the last month. This chart measures the percentage of carrier prefixes originating from our Atlanta POP that had the best and worst performing routes for any given day of the month. While individual carrier performance can vary radically, if you’re a Performance IP® customer this won’t be a concern for you. Since the engine measures network paths millions of times a day, Performance IP® sends outbound traffic along the lowest latency path virtually 100 percent of the time.
The final tab of the demo allows you to study our product line-up and open a chat to get a quote. Performance IP® is available for INAP colocation customers and is included with INAP Cloud products. If you’re not interested in these infrastructure solutions, you can still purchase Performance IP® from one of our data centers and connect it to your environment.
Run the test for yourself, or chat with us now to get a quote.
Explore HorizonIQ
Bare Metal
LEARN MORE
Stay Connected


About Author

Colocation Pricing Guide: Power, Space and Key Questions to Ask Your Provider
Considering colocation as part of your infrastructure mix? Colocation pricing depends on your power and spacing needs as you shift all or some of your infrastructure off-premise and into a data center. That’s why we’ve put together our colo pricing guide to help you understand power, space, and the key questions to ask your provider to decide the best fit for your company.
If you’re looking at colocation as a solution for your company, you’re not alone. Migration of infrastructure to colocation facilities will continue full force for the next few years, according to a survey put out to 500 IT professionals. Why? Because most on-prem data centers can’t compare to Tier 3-design facilities.
The best colocation data centers offer high uptime, power efficiency, and redundancy, as well as improve the physical security of the infrastructure. With an enterprise colocation solution, companies also have access to greater networking capabilities and public cloud and/or other multi-platform solutions. This flexibility future-proofs your infrastructure for whatever needs may arise over time.
Find the optimal pricing structure for you to make the most of these benefits.

What You Need to Know About Colocation Pricing
Below, you’ll find the common types of billing for power, the spacing options you can choose from, and two examples of how power and space are billed together.
Start with Your Power Needs
There are four standard ways to bill for power. When you’re working with your colocation provider, ensure they’re gathering your current and future power needs to appropriately size the power circuits. With that information in hand, they should work to offer you the best deal and least costly solution.
1. Per Circuit (Flat Rate) Power Billing
The bill is a flat monthly fee per circuit provisioned for your solution and is the most common colo pricing structure. With this model, you have price predictability. You’ll pay the same amount whether you use five percent or 80 percent of your capacity. But be warned, there is no ability to burst above 80% of the delivered power without adding additional circuits.
2. Power Capacity kW (Allocated kW) Billing
In this model, you make a commitment to use a fixed amount of power (i.e.: 100kW), regardless of the electrical capacity of the circuits installed. Typically, you’ll see savings over flat rate model; however, the penalties for bursting above your committed rate can be quite steep.
3. Metered Power (Usage Based) Billing
Your bill will vary in this model. The monthly fee is based on actual usage and is determined on the present rate per kilowatt hour. Colocation providers typically only offer this pricing model on very large deployments and customers will still have to pay for space.
4. All In Space & Power
This is a simple calculation of the amount of space and power presented in a per kW number. It’s a very easy way for customers to compare pricing (assuming space and power delivered is equal). A con to this solution is that both the space and power are tied to a single rate per kW so there is a loss of flexibility. If you ever need to upgrade just the power, you’ll end up paying more for the same amount of space.
Explore Colocation Space Options
Colo space is typically sold by:
Cabinet: A single lockable cabinet on the data center floor. You can purchase contiguous cabinets if they are available in your chosen data center.
Cage or Private Suite: An enclosed, lockable, segmented cage on the data center floor that provides superior flexibility and control without the capital investments that come with building and maintaining an enterprise-grade facility. A minimum of 5 racks/cabs is standard for cage deployments, assigned at 24 square feet per rack. Private data center suites, on the other hand, are built to suit (complete with separate security access points) and are used typically for larger, wholesale colo deployments.
Remember though, for some colocation pricing models, your bill may not have anything to do with square footage or rack usage. While cabinets or square feet are still required in order to allocate an area within the data center, the price is attached to the power that is being allocated for your use.
What Are Common Types of Colo Pricing Solutions?
Now that we understand the options for space and power billing, let’s explore how both aspects come together with two examples of popular billing models, relative to the deployment size. Work with your colocation provider to determine your best-fit solution.
Cabinets with flat-rate circuits
For smaller deployments, typically one to four cabinets, colocation providers will deliver lockable cabinets, each with primary and redundant (optional) power feeds. A single power feed can deliver anywhere from 2kw – 17kw depending on the colocation provider’s power capacity and cooling capabilities. Your bill would consist of line items for the cabinet(s) and circuits delivered.
Space/kw with Usage-based Power Pricing
This solution is for larger deployments (100kw+), as providers will typically have minimums for this solution. You’ll be billed based on the number of square feet and a variable monthly fee based on actual power usage. This monthly fee is based on a preset dollar rate per kilowatt hour. Regardless of term, installs should be charged in this model.
Typically, there is not much of a margin built into usage-based power. You should also expect install fees when adding more circuits.
Beyond the Price Tag: What Can the Colocation Data Center You Choose Do for You?
When you decide to move your infrastructure off-prem, there are many other economic and performance-based factors beyond the list price for space and power; however, they are just as important to consider and can even make or break your infrastructure strategy.
Consider the following questions:
1. Does the colo facility have Tier 3-attributes?
To be a Tier 3-attribute data center, the facility must maintain N+1 fault tolerance, 72-hour protection from power outages, and 99.982 percent uptime. Concurrent maintainability also ensures that a single critical component failure—electrical, cooling, power, etc.— will not disrupt service because of the redundant systems in place. How does the data center you are considering stack up?
2. Does the colo provider offer multi-platform contract flexibility?
Infrastructure needs can change fast. Make sure your provider gives you flexibility through the implementation of different platforms (cloud, bare metal, etc.), as well as spend portability after you deploy so that you can switch up your infrastructure solutions to stay agile and keep pace with your company’s goals and workloads.
3. Does the colo provider support High Power Density environments?
With a high-power density configuration, you can fit more gear into a smaller space and reduce your overall footprint. This becomes especially important if you’re looking to deploy any type of hyper-converged solution.
4. Can I get high-performance, low-latency bandwidth?
Bandwidth is an essential cost that you cannot overlook when sourcing any data center or cloud solution. If you’re powering any mission-critical applications with your colocation deployment, look for a colocation data center that has a quality blend of ISPs and inquire about latency averages.
5. Does the colo provider offer interconnectivity solutions?
Ideally, you’ll want a provider who offers a high-capacity private network that allows you to connect across various data centers throughout the country or around the globe. If your colo provider lacks interconnectivity solutions, you’ll need to partner with other vendors for interconnectivity options, which can be a future pain point.
6. Does your provider offer geographically dispersed data centers for disaster recovery?
Ultimately, you may require some sort of secondary site for any disaster recovery solution as part of your overall business continuity plan. Look for a provider that either has multiple sites across a geographically dispersed area or some sort of off-site DRaaS product that works for your company.
7. What about onsite support?
Onsite expert support technicians can keep your infrastructure online, secure, and always operating at peak efficiency when your own IT staff is unable to. Make sure your colo provider offers remote hands support and don’t leave it out of your colo budgetary considerations. You’ll also want to ensure that your data is protected by 24/7/365 onsite security/personnel.
For more information on colocation pricing, or to find the best solution for you, chat now.
Explore HorizonIQ
Bare Metal
LEARN MORE
Stay Connected
About Author